OpenGov
Dashboards
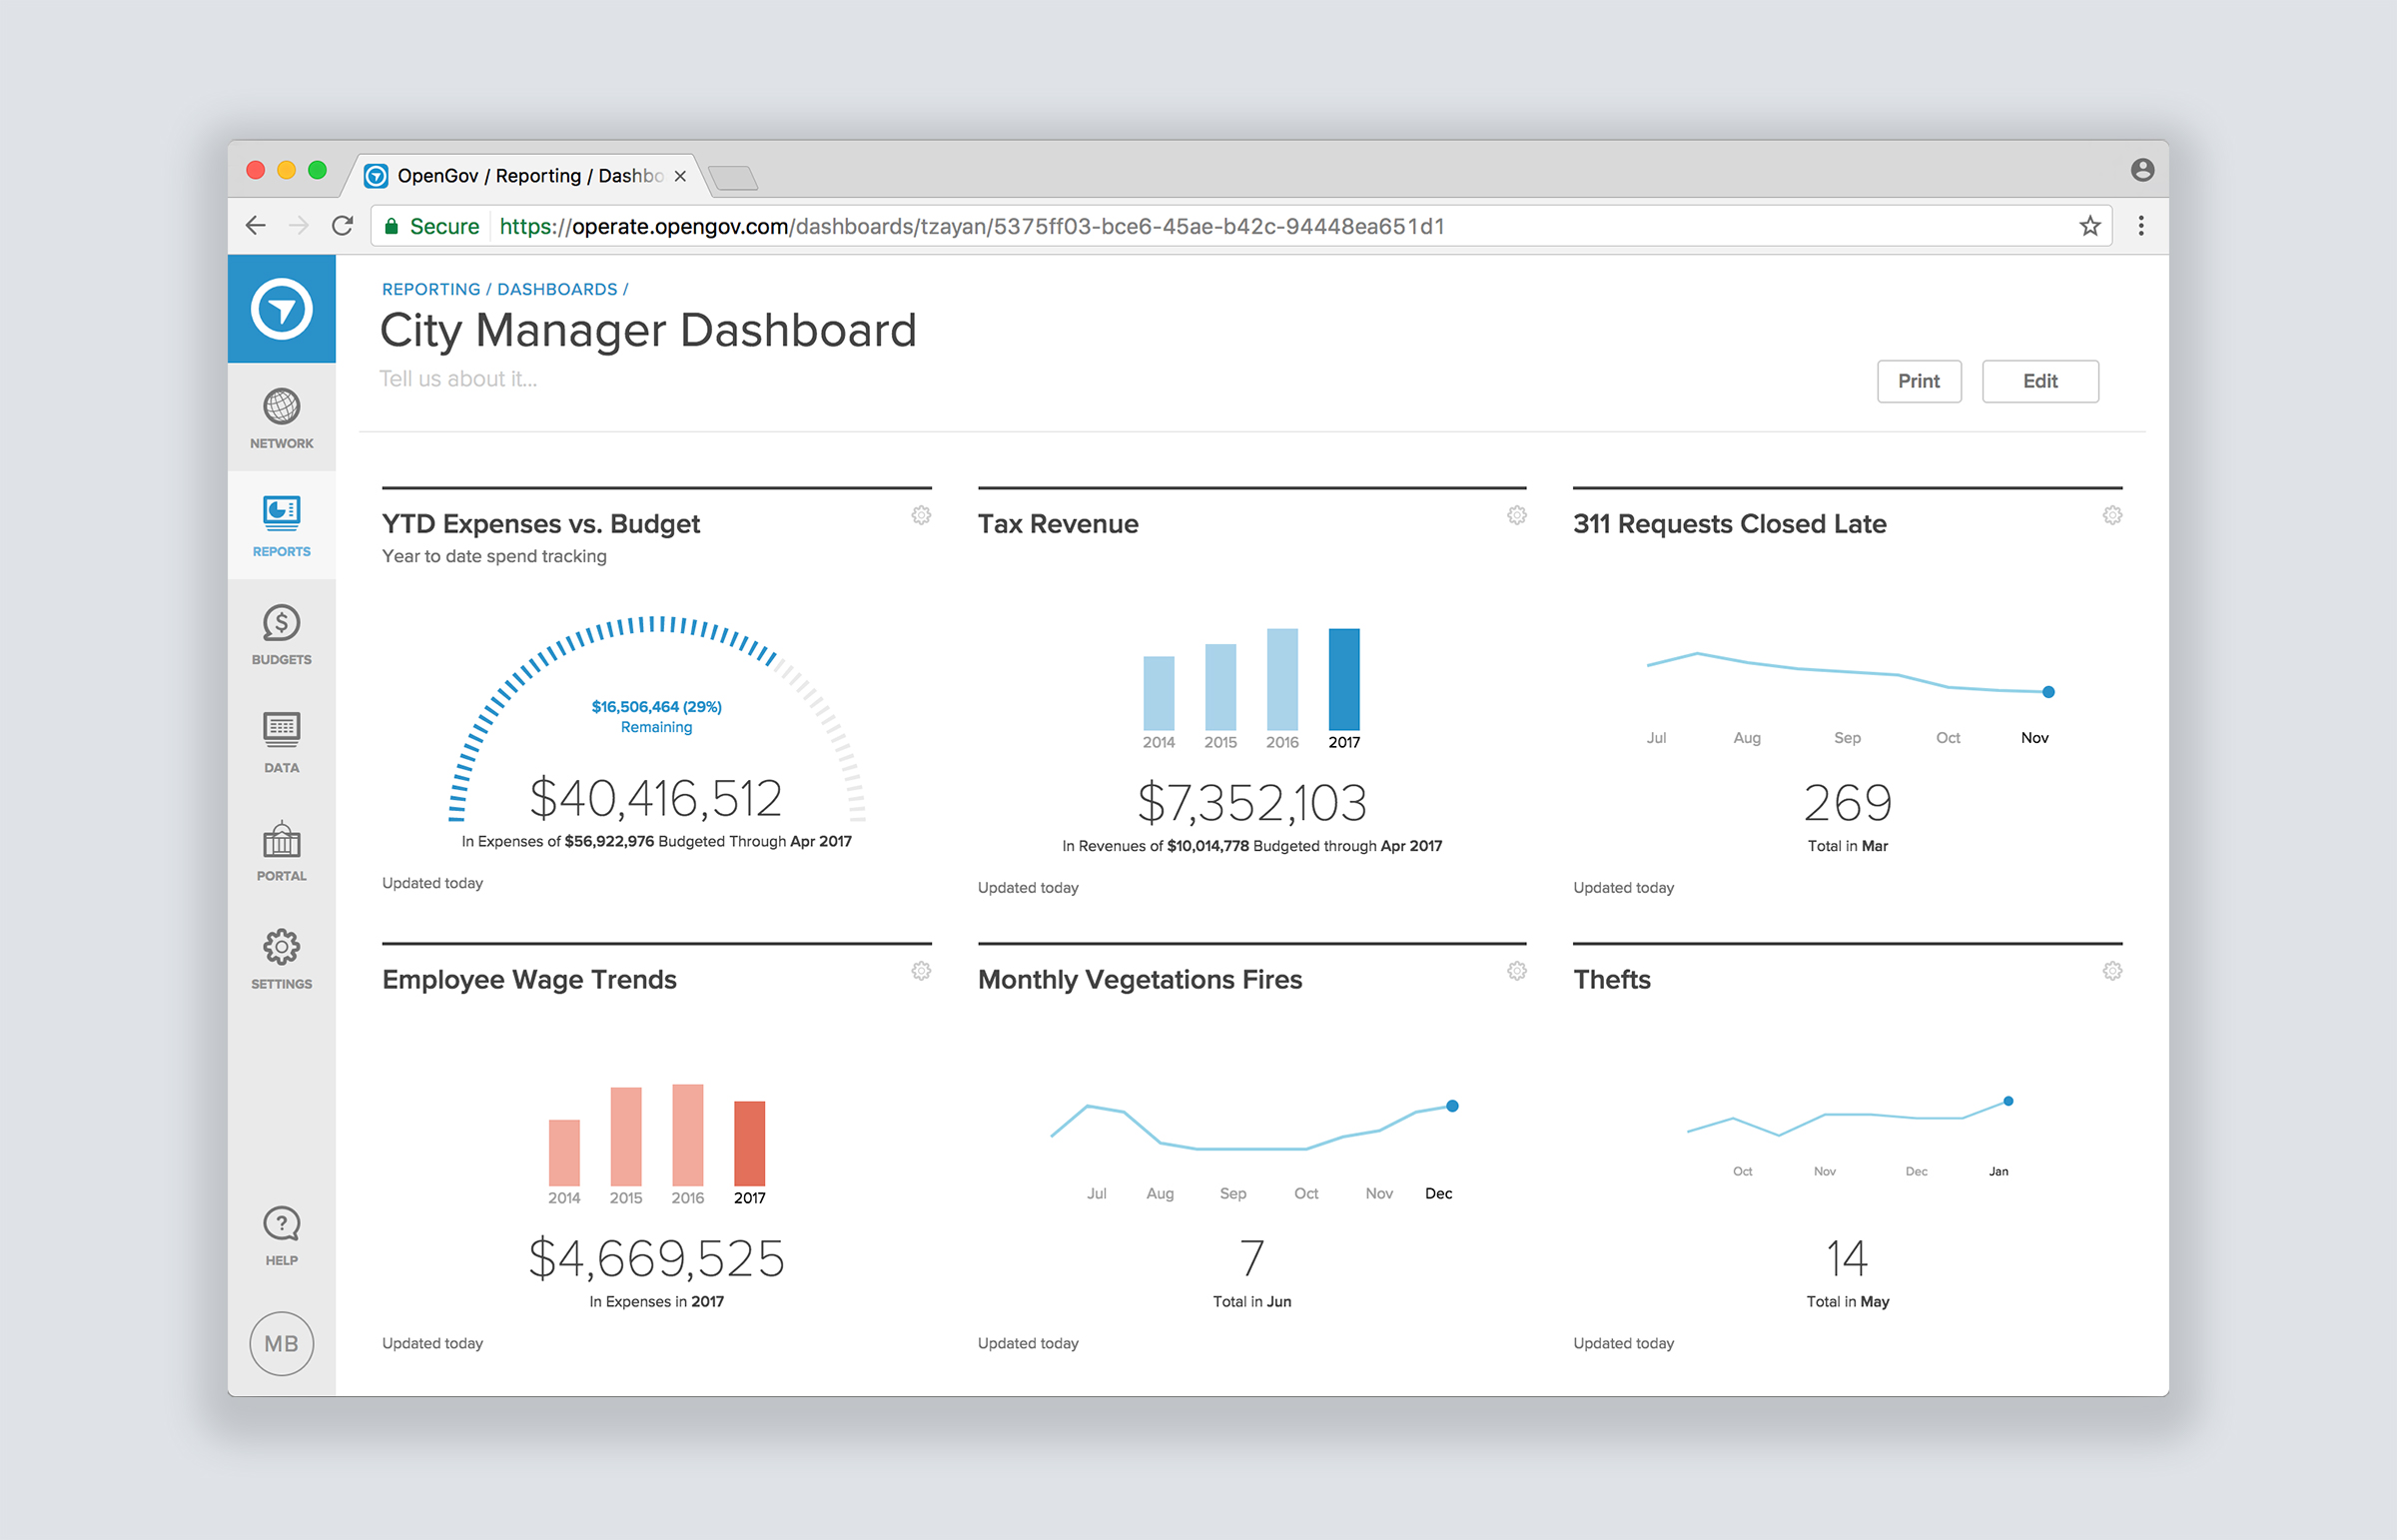
Allow users to monitor their finances and performance measures in a single place, leveraging information from reports.
Basics
Problem
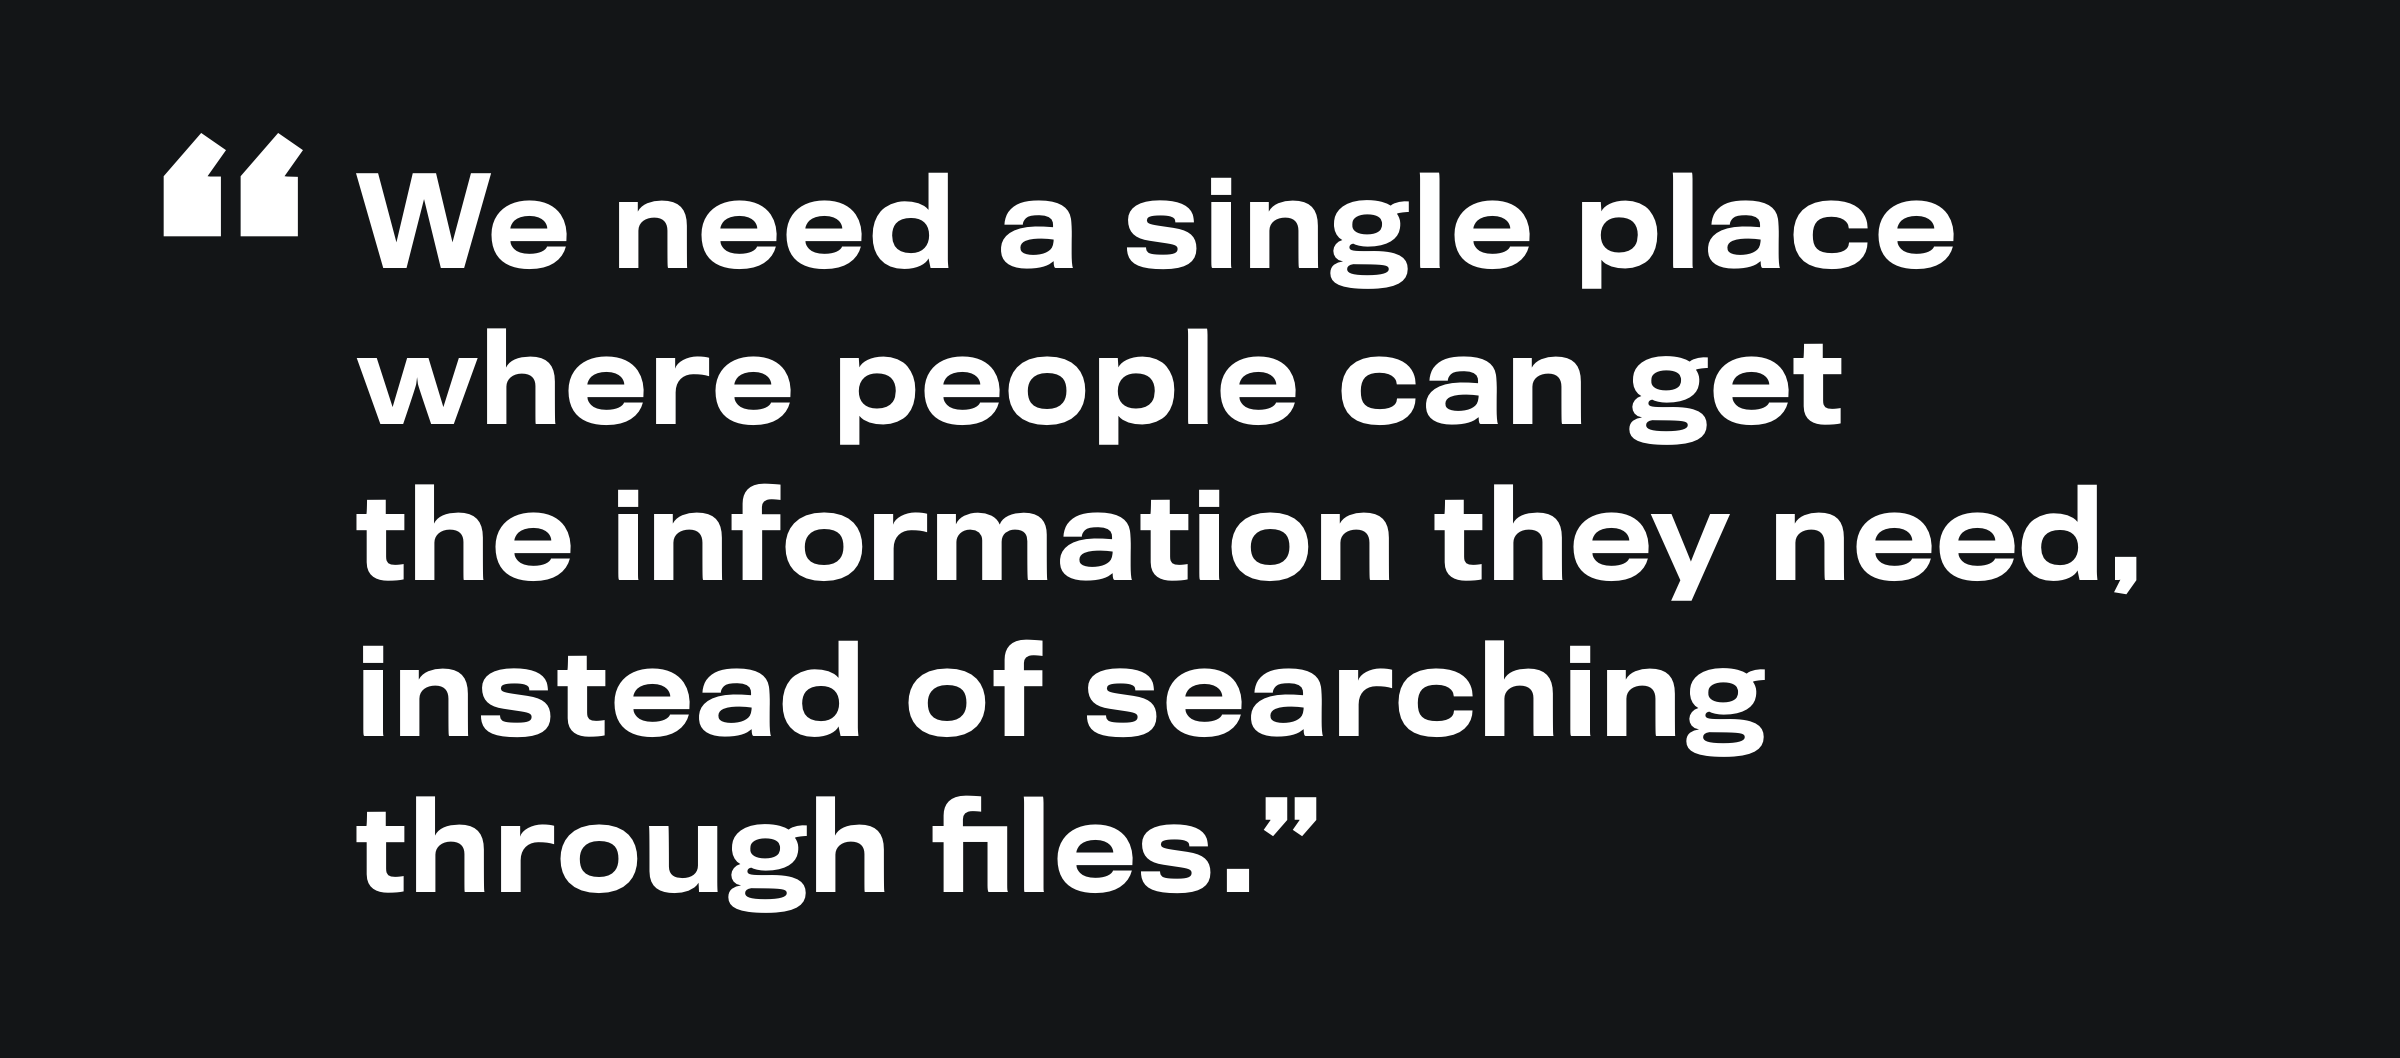
This project began because customers and prospects asked for it by name. “Do you have dashboards?” was a common question on calls. Defining the problem really was an exercise in what customers meant by “a dashboard” and how they anticipated using it.
What we learned was while OpenGov’s reporting product had powerful data exploration capabilities, it didn’t meet managers’ need for a quick snapshot of “How are we doing?” An aggregate view of a municipality’s finances and performance measures was clearly needed.
Role
- Research
- Prototyping
- Interaction Design
- Visual Design
Goals
- Present data in a way that’s actionable
- Create reusable building blocks for suite
- Explore more sophisticated visuals
Process
Research Insights
Governments need to monitor to stay accountable.
The full picture is often in pieces in different reports in OpenGov and leadership doesn’t have time to poke around.
Users need to quickly get into why something is off.
Explore
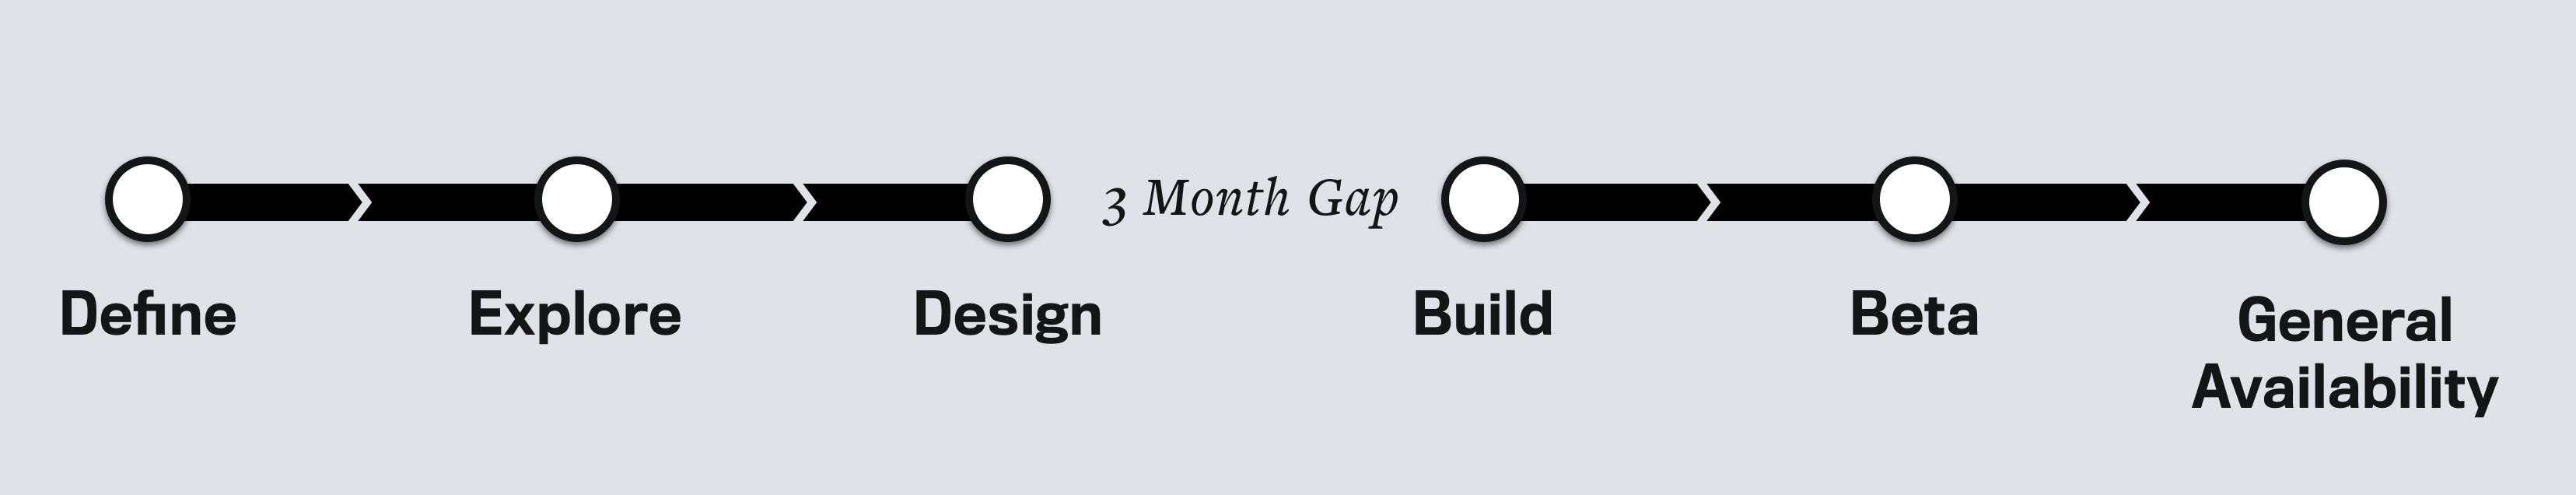
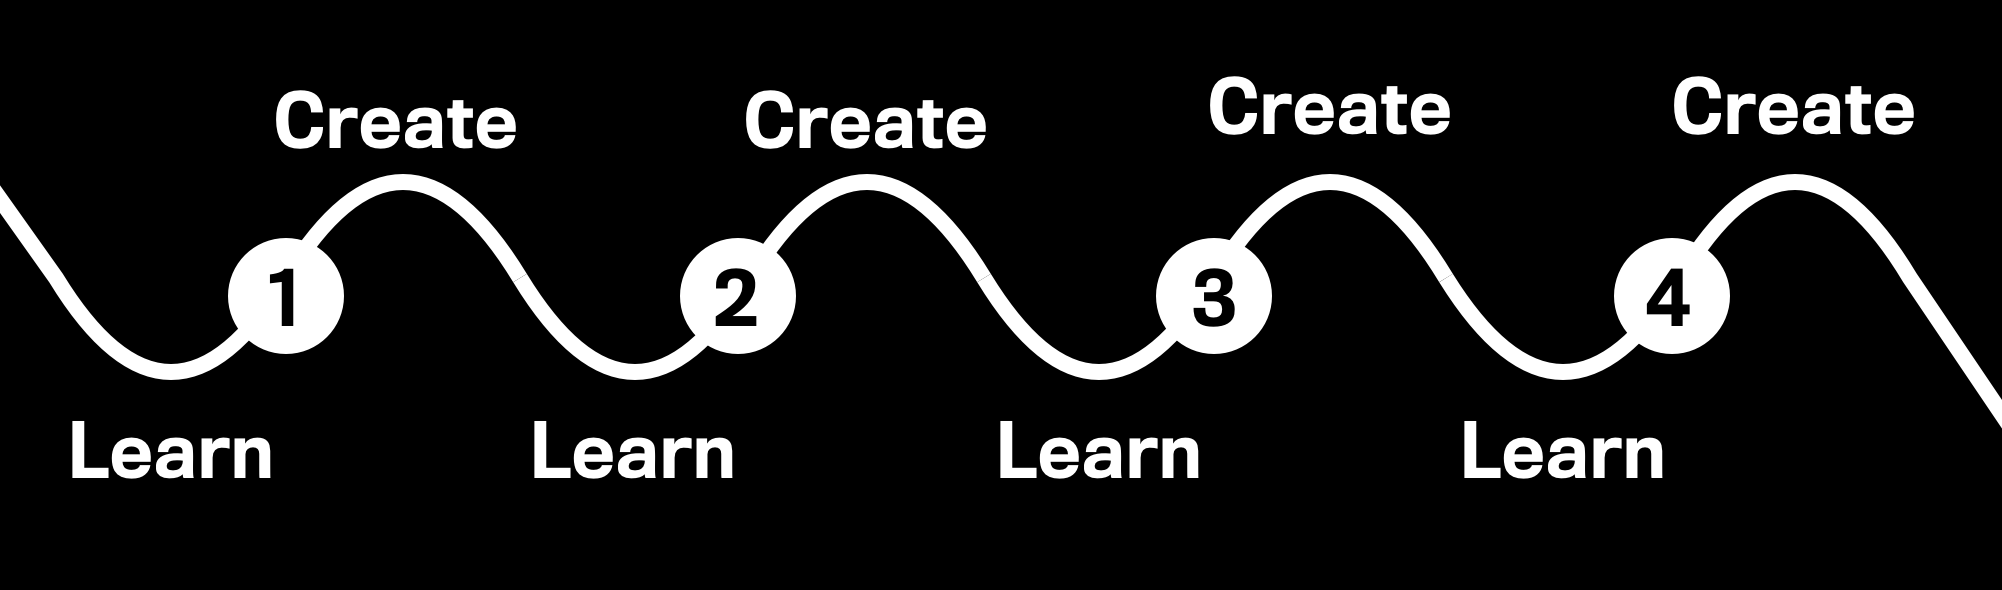
We were lucky to have an unusual amount of access to customers so we met with each four times while developing designs.
Exploration
Collect background on what a dashboard is
Feedback 1
Test different creation models
Feedback 2
Test a clickable prototype
Feedback 3
Gather feedback on visuals and data mappings
This allowed us to test out different paradigms for how to solve this.
Through feedback, we were able to zero in on the required data, information architecture, and visual design for the tiles.
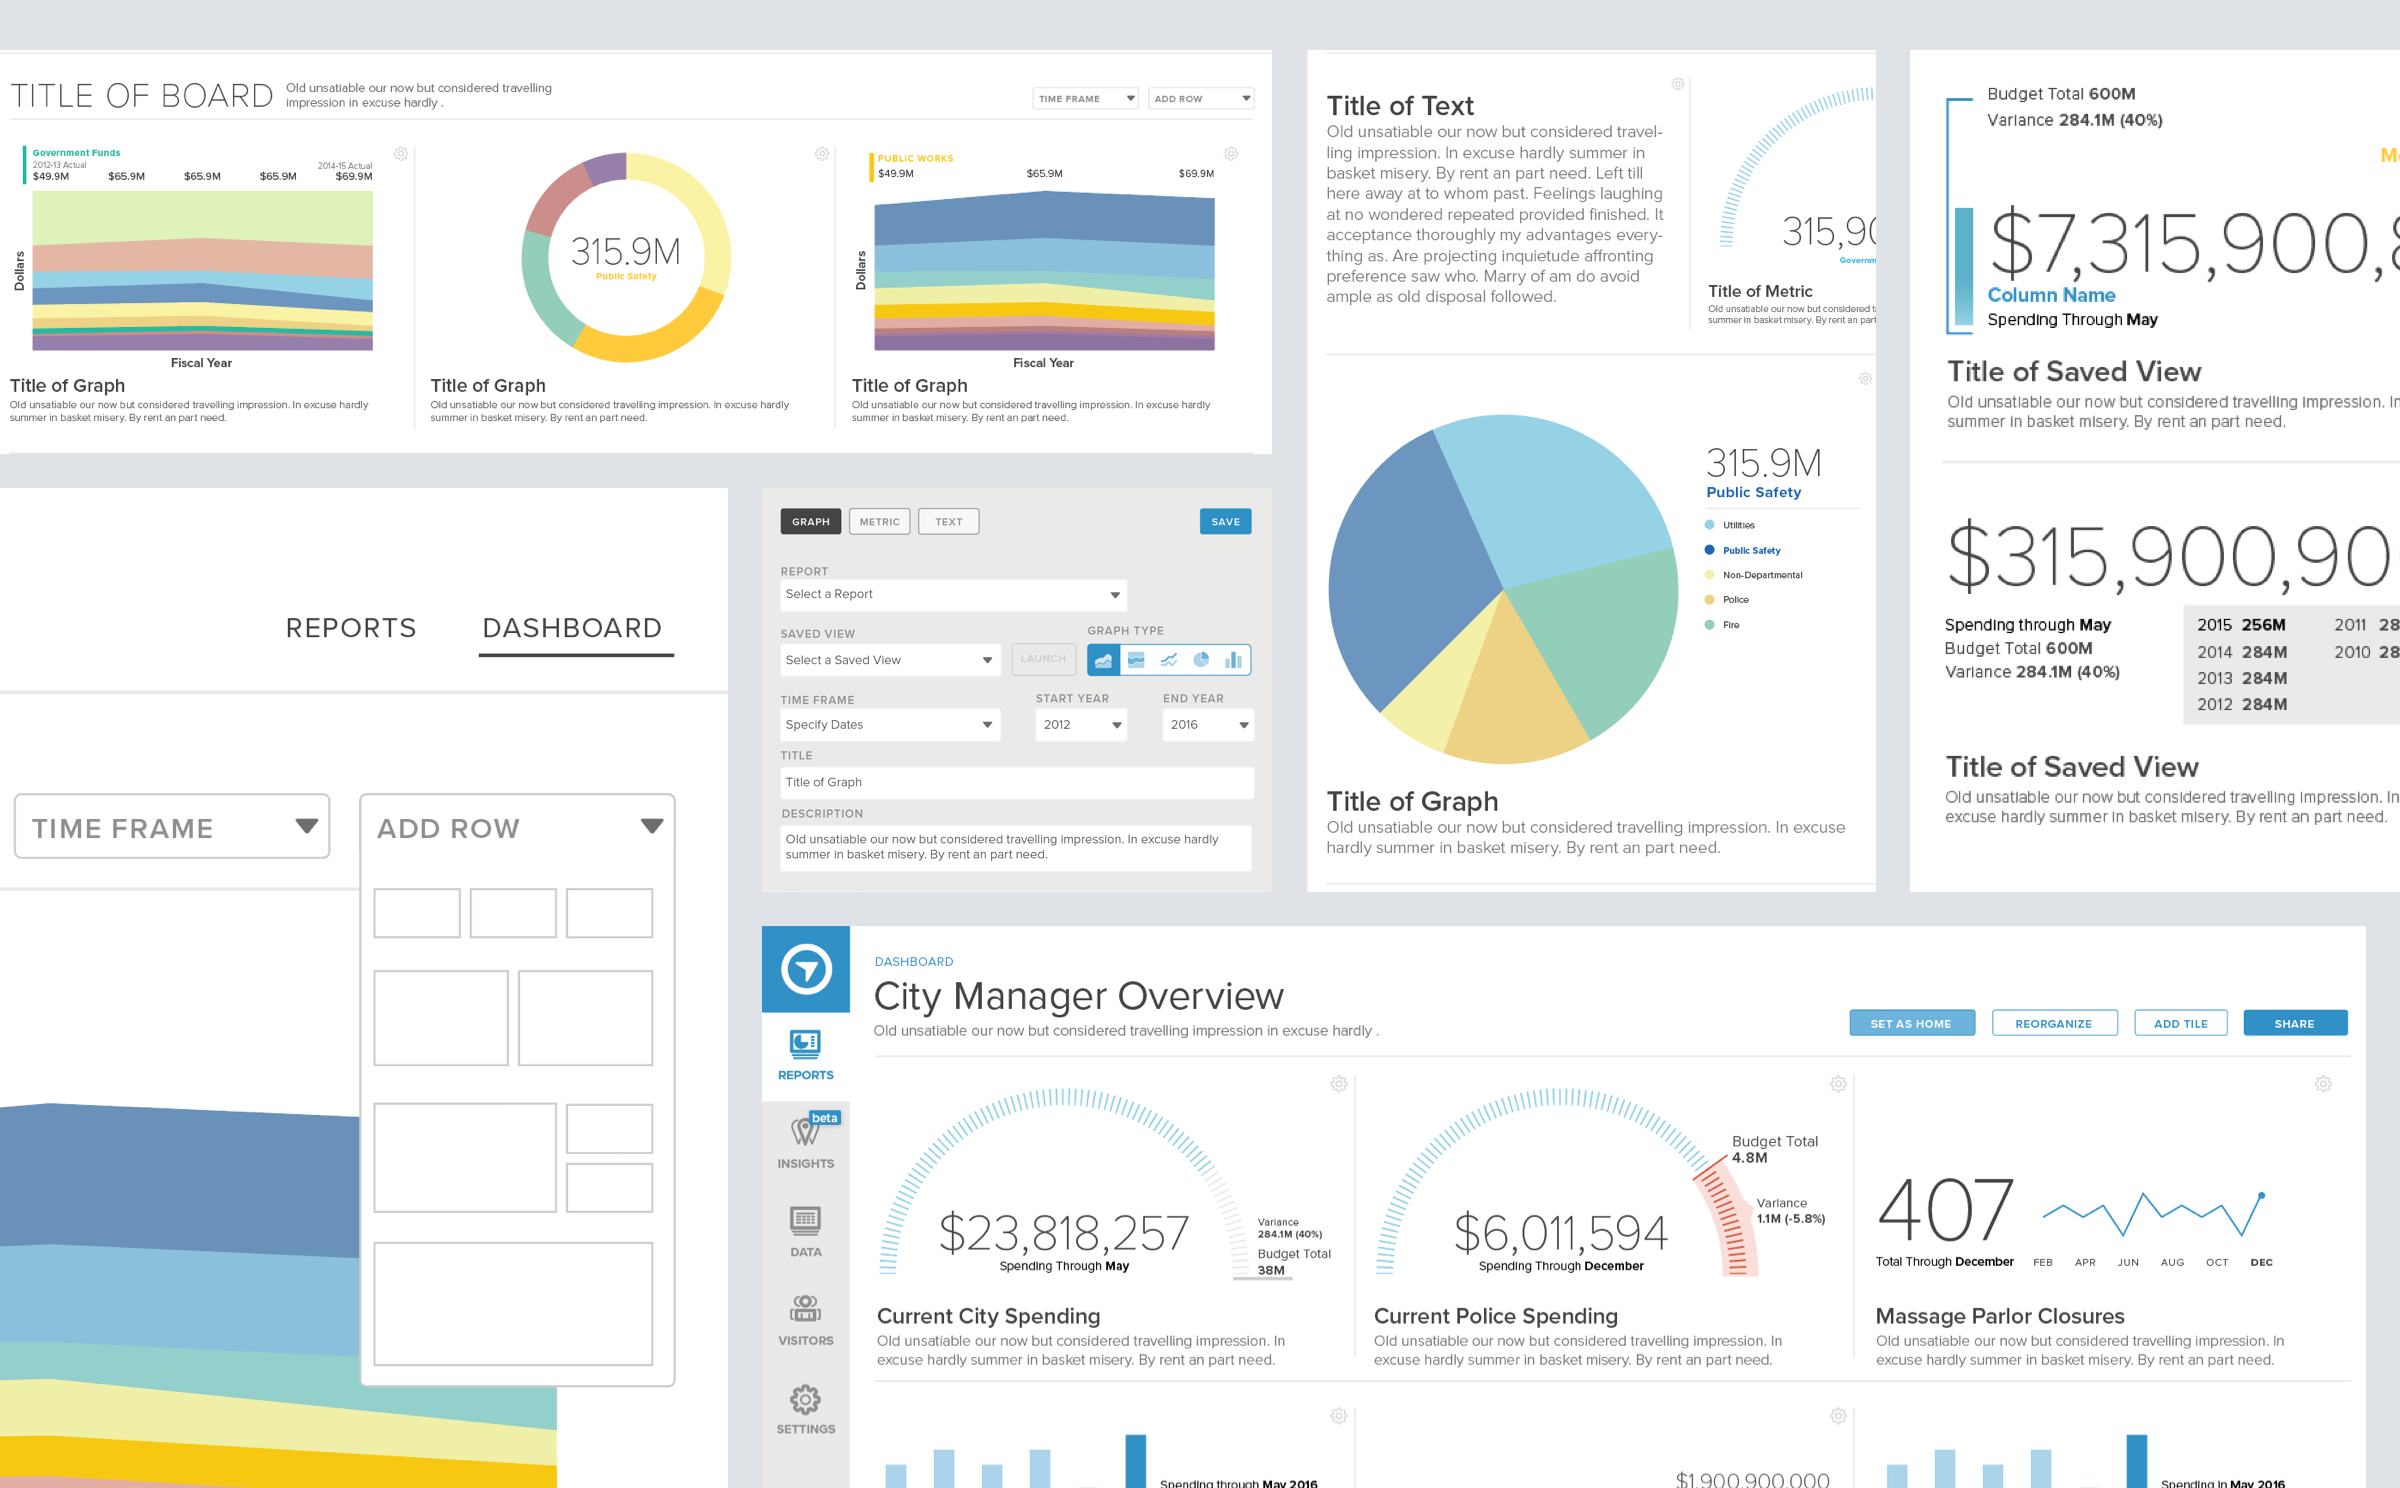
Design
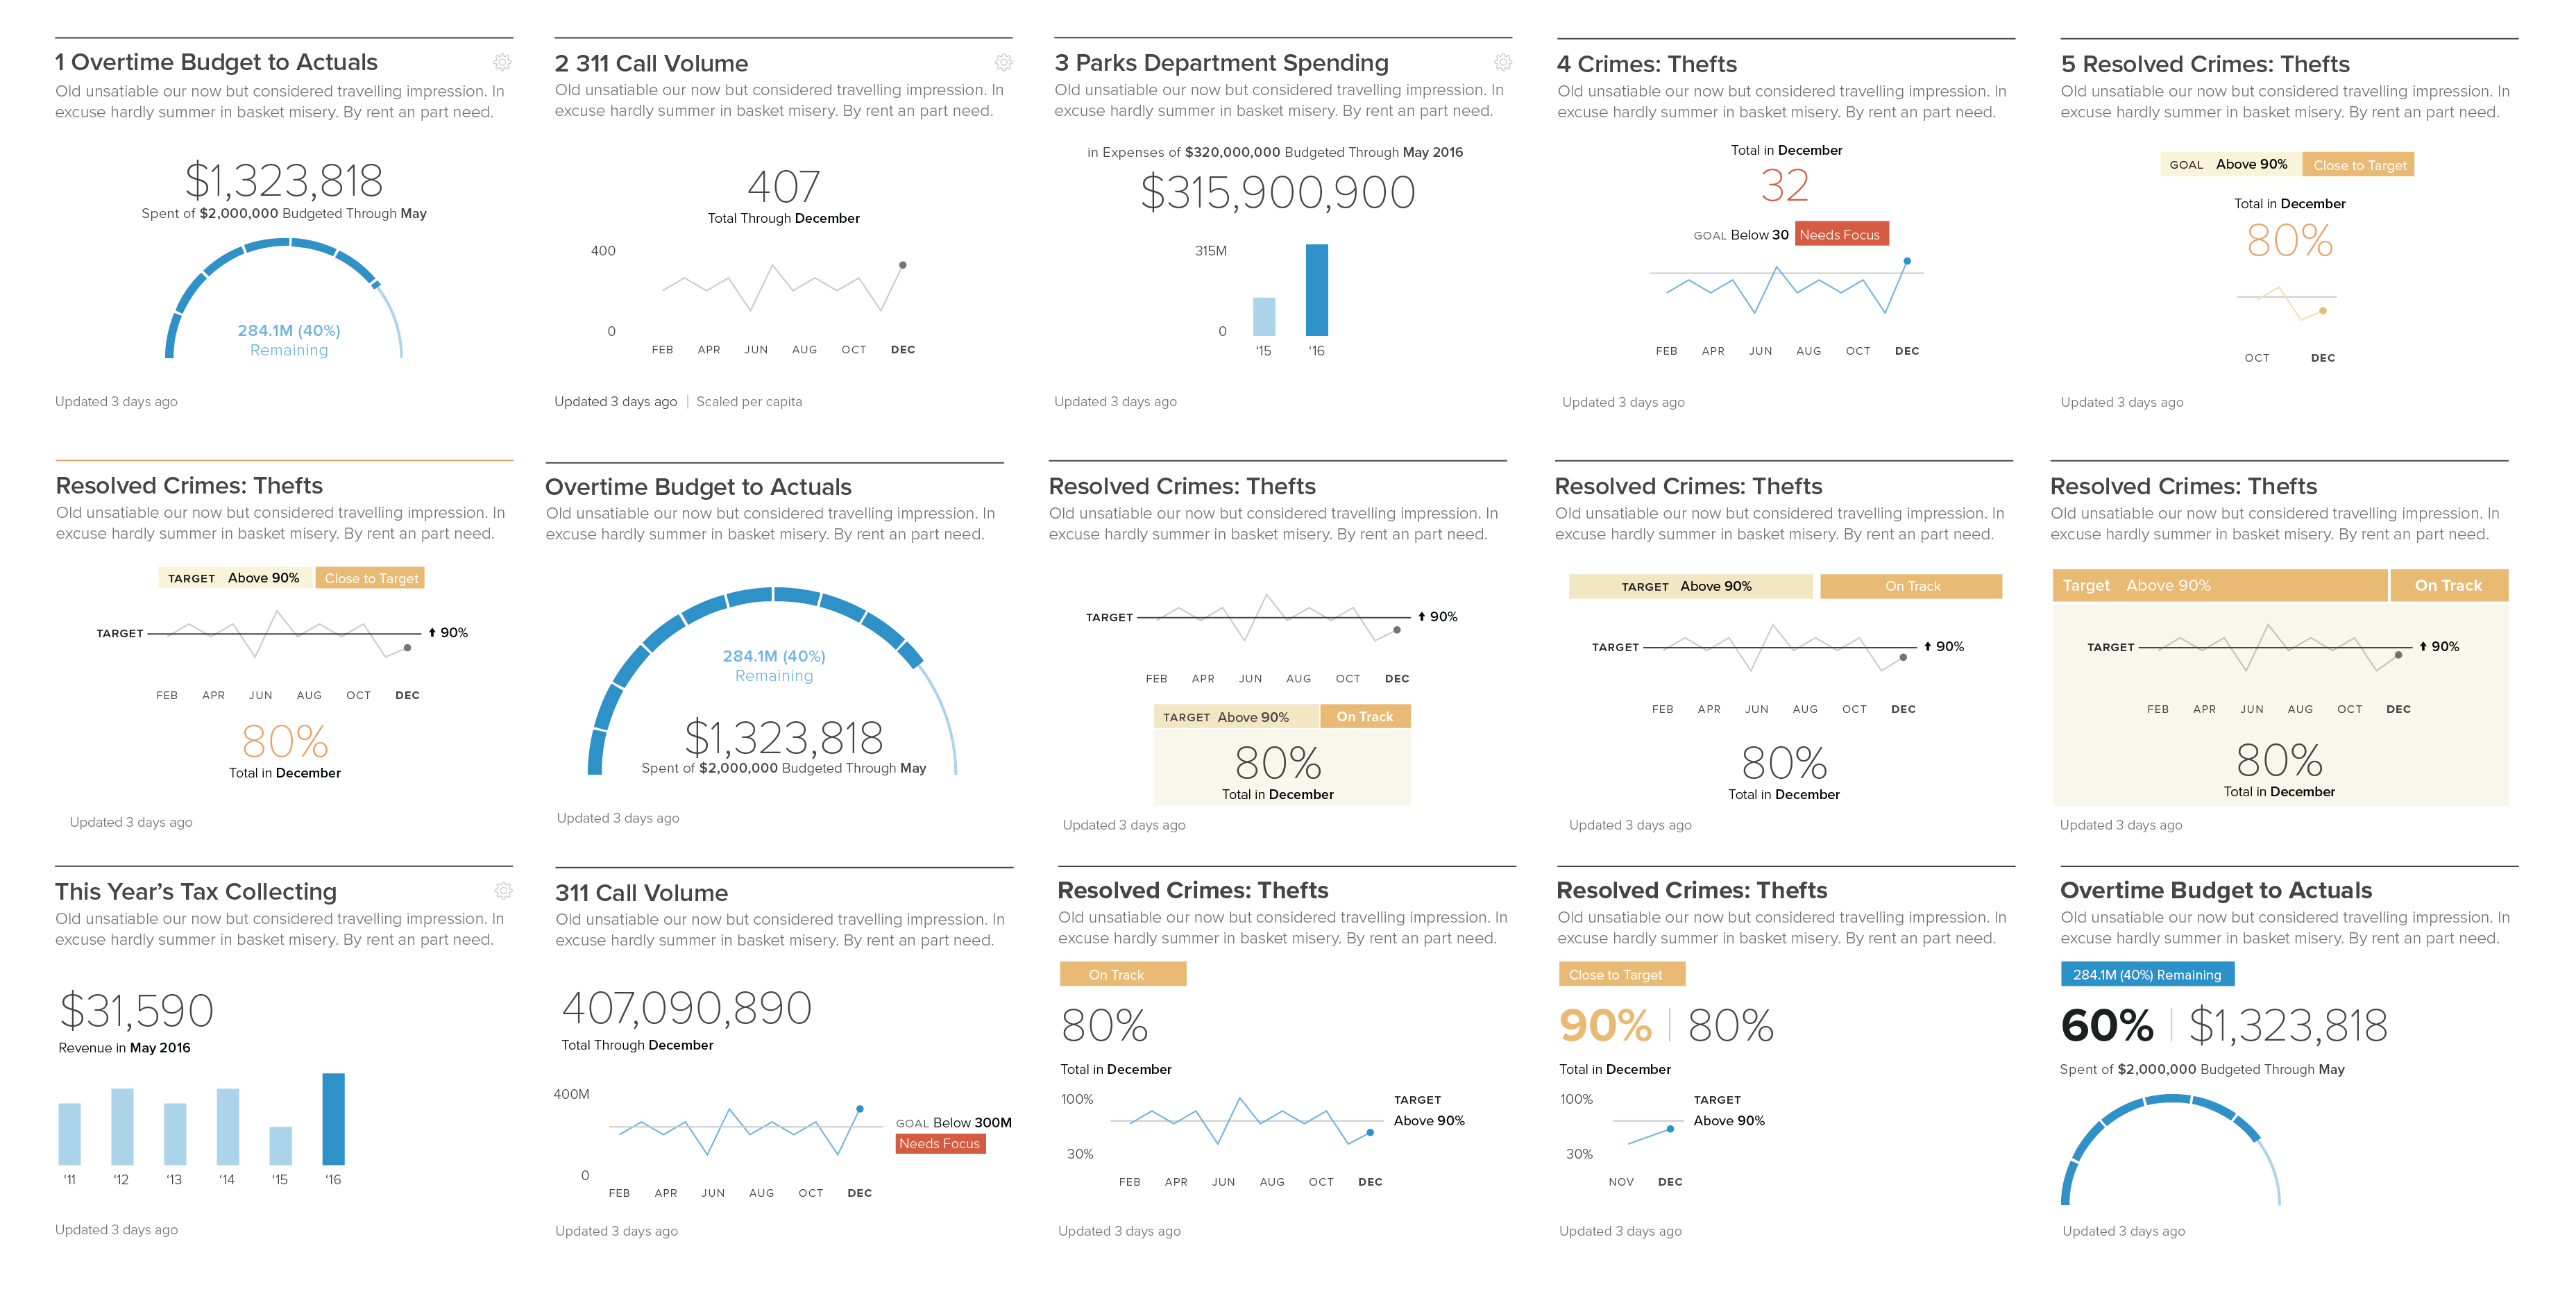
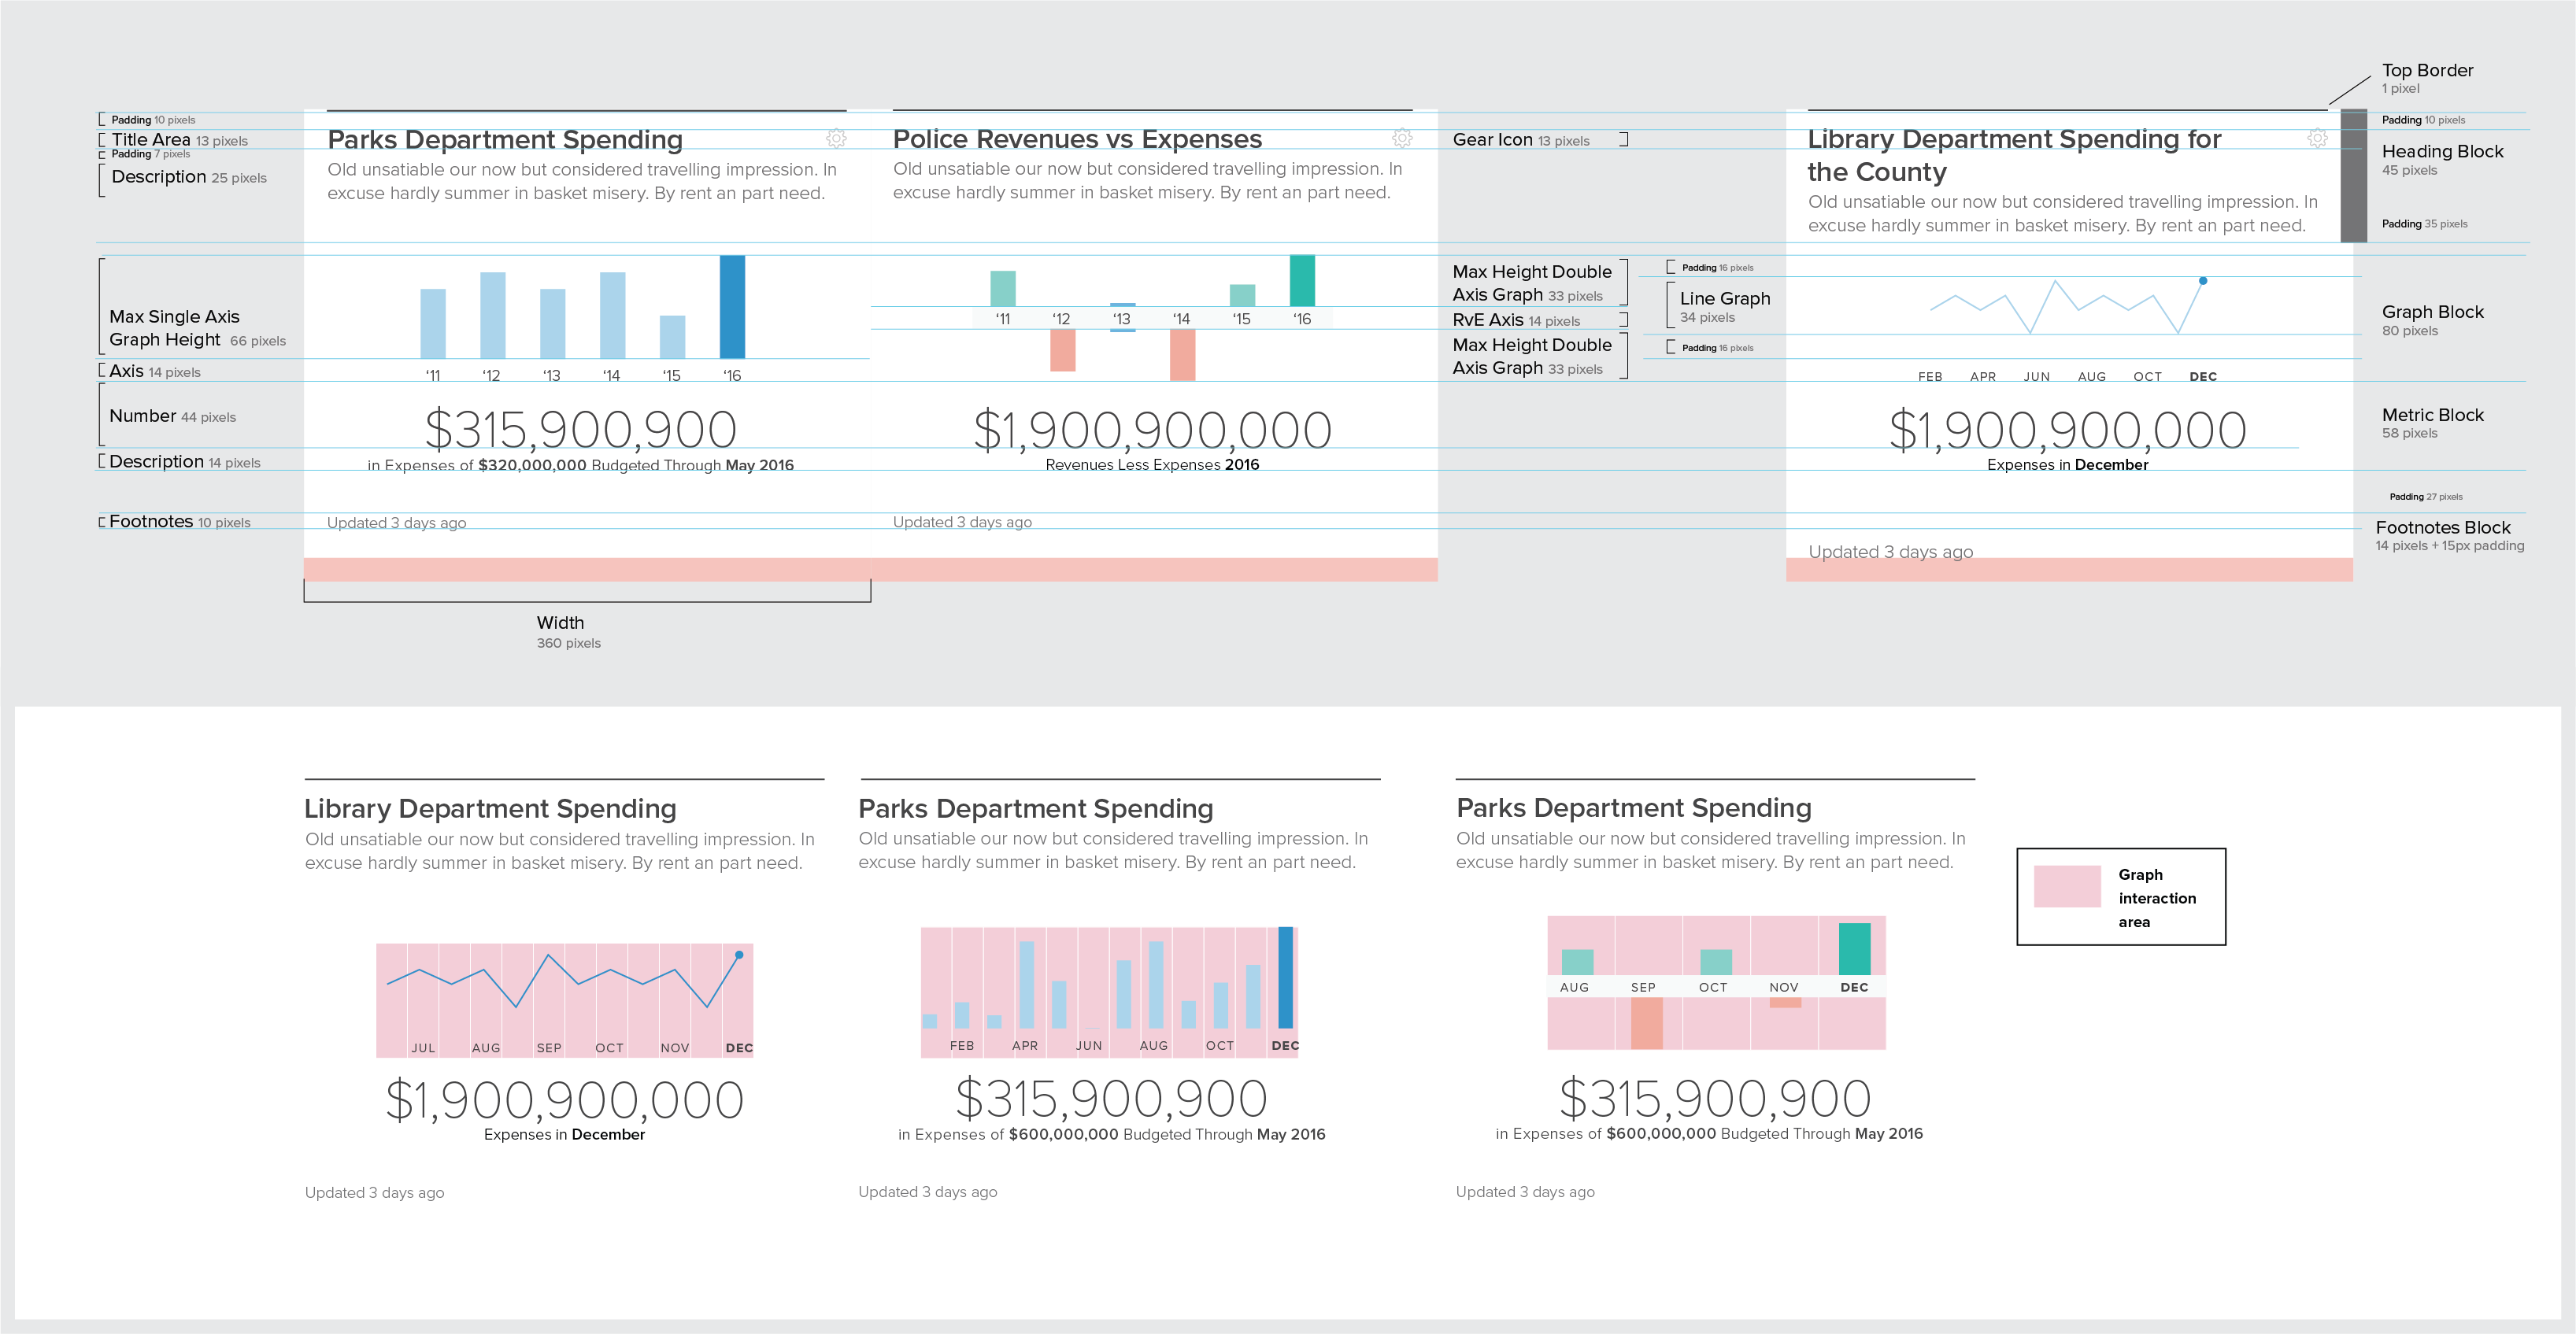
Because of the scale of this product we needed to systematize and standardize the tile components.
Results